|
Time
|
Data and Events
|
Importance
|
|
04:30
|
U.S. API Crude Oil Inventory for the week ending June 28
|
★★★
|
|
17:00
|
Eurozone Unemployment Rate for May
|
★★★
|
|
19:30
|
U.S. Challenger Job Cuts for June
|
★★★
|
|
20:15
|
U.S. ADP Employment Change for June
|
★★★★
|
|
22:30
|
U.S. EIA Crude Oil Inventory for the week ending June 27
|
★★★★
|
|
U.S. EIA Cushing, Oklahoma Crude Oil Inventory for the week ending June 27
|
★★★
|
|
U.S. EIA Strategic Petroleum Reserve Inventory for the week ending June 27
|
★★★
|
|
Variety
|
Viewpoint
|
Support Range
|
Resistance Range
|
|
U.S. Dollar Index
|
Weak oscillation
|
96-97
|
99.5-100
|
|
Gold
|
Short-term rebound
|
3220-3250
|
3350-3380
|
|
Crude Oil
|
Short-term adjustment
|
64-65
|
79-80
|
|
Euro
|
Strong oscillation
|
1.1680-1.1700
|
1.1830-1.1850
|
*Pre-market views are time-sensitive and limited, are predictions only, for reference and learning purposes, do not constitute investment advice, and the risk of operation is borne by the individual. Investment carries risks; trading requires caution.
Fundamental Analysis:
In June, the Federal Reserve maintained interest rates for the fourth consecutive time, with the dot plot indicating two rate cuts within the year. Inflation levels are slightly high, and uncertainty in the economic outlook has somewhat diminished, with the unemployment rate at a low level and a stable labor market. In May, non-farm payrolls added 139,000 jobs, which is basically in line with expectations, and the unemployment rate remained unchanged, indicating a robust labor market. The year-on-year CPI for May rose slightly but was below expectations; the core PCE price index also saw a slight rebound; the ISM manufacturing PMI for May showed a slight increase. Focus on the non-farm data on Thursday.
Technical Analysis:
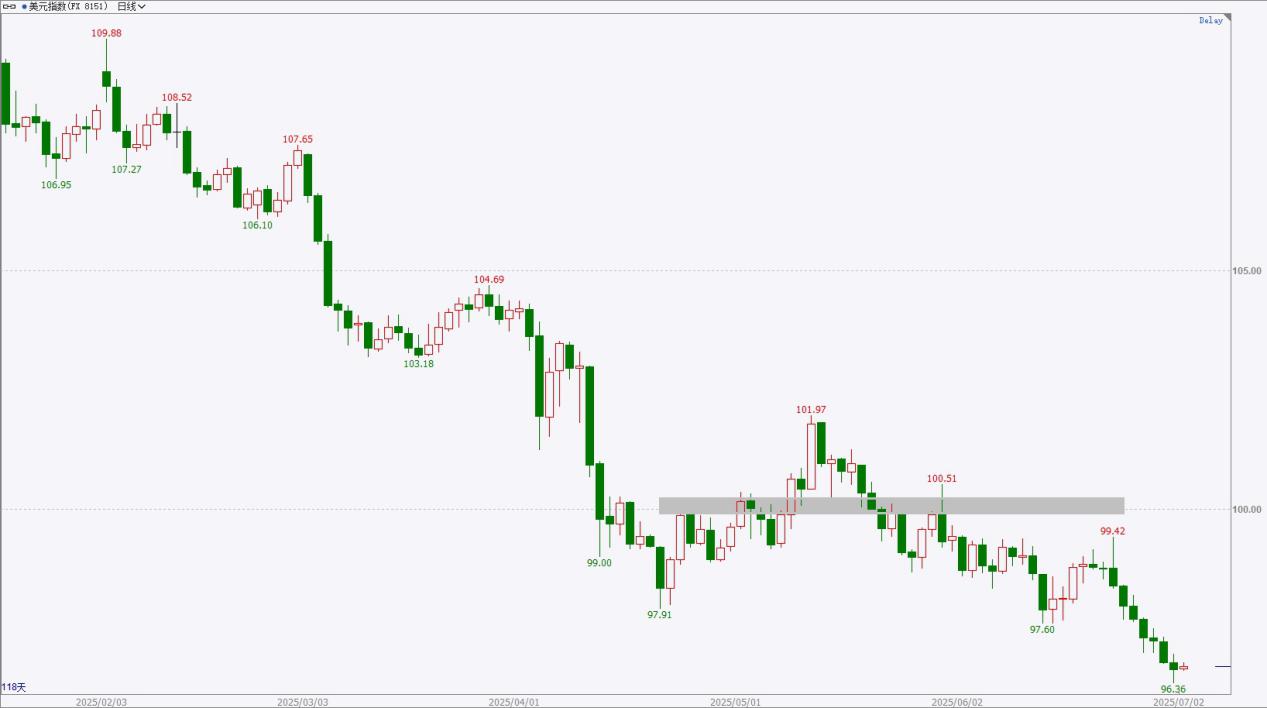
The U.S. Dollar Index has recently shown weak performance, with daily oscillations trending downward, and new lows in shorter cycles without signs of a rebound. In the short term, it may continue to show weak oscillation, but caution is advised for small-scale rebounds. Overall, the larger structure indicates a weak oscillation, with a large bearish candle on the weekly chart, maintaining a weak trend. The upper resistance area is around 99.5-100, while the lower support area is around 96-97.
Viewpoint: Weak oscillation, prices have reached new lows without signs of stabilization.
*Pre-market views are time-sensitive and limited, are predictions only, for reference and learning purposes, do not constitute investment advice, and the risk of operation is borne by the individual. Investment carries risks; trading requires caution.
Fundamental Analysis:
Geopolitical tensions in the Middle East are escalating, with conflicts between Israel and Iran, and instability in Eastern Europe. The European Central Bank’s June interest rate decision marked the seventh consecutive rate cut of 25 basis points, nearing the end of the rate-cutting cycle, while lowering inflation expectations for this year and next, as well as GDP growth expectations for next year. The Federal Reserve’s June interest rate decision maintained rates, with slightly high inflation levels and a stable labor market, indicating two rate cuts within the year. In May, U.S. non-farm payrolls saw a slight decline in new jobs, with the unemployment rate remaining unchanged; the year-on-year CPI for May showed a slight increase. Focus on U.S. non-farm data.
Technical Analysis:

Gold prices continued to rebound yesterday, showing strong performance in shorter cycles, but there may be selling pressure above. If there are long positions, consider taking profits on highs and watch whether the resistance level can be broken. If it breaks, the trend may strengthen; otherwise, the probability of oscillation back and forth is high. From a larger cycle perspective, the daily chart shows high-level oscillation with prices fluctuating. The upper short-term resistance level is around 3350-3380, while the lower support level is around 3220-3250.
Viewpoint: Short-term rebound, if there are long positions, take profits in a timely manner, and pay attention to whether the current resistance level can be broken.
*Pre-market views are time-sensitive and limited, are predictions only, for reference and learning purposes, do not constitute investment advice, and the risk of operation is borne by the individual. Investment carries risks; trading requires caution.
Fundamental Analysis:
June EIA monthly report slightly raised crude oil prices for this year and next; OPEC monthly report maintains global oil demand growth expectations for this year and next, and maintains economic growth expectations for this year and next; IEA monthly report slightly lowered oil demand expectations for this year and next. At the end of May, the OPEC+ ministerial meeting agreed to set 2025 oil production as the benchmark for 2027, with another round of negotiations expected in early June, potentially reaching an agreement to accelerate oil production increases in July. Pay attention to the EIA crude oil inventory report on Wednesday.
Technical Analysis:
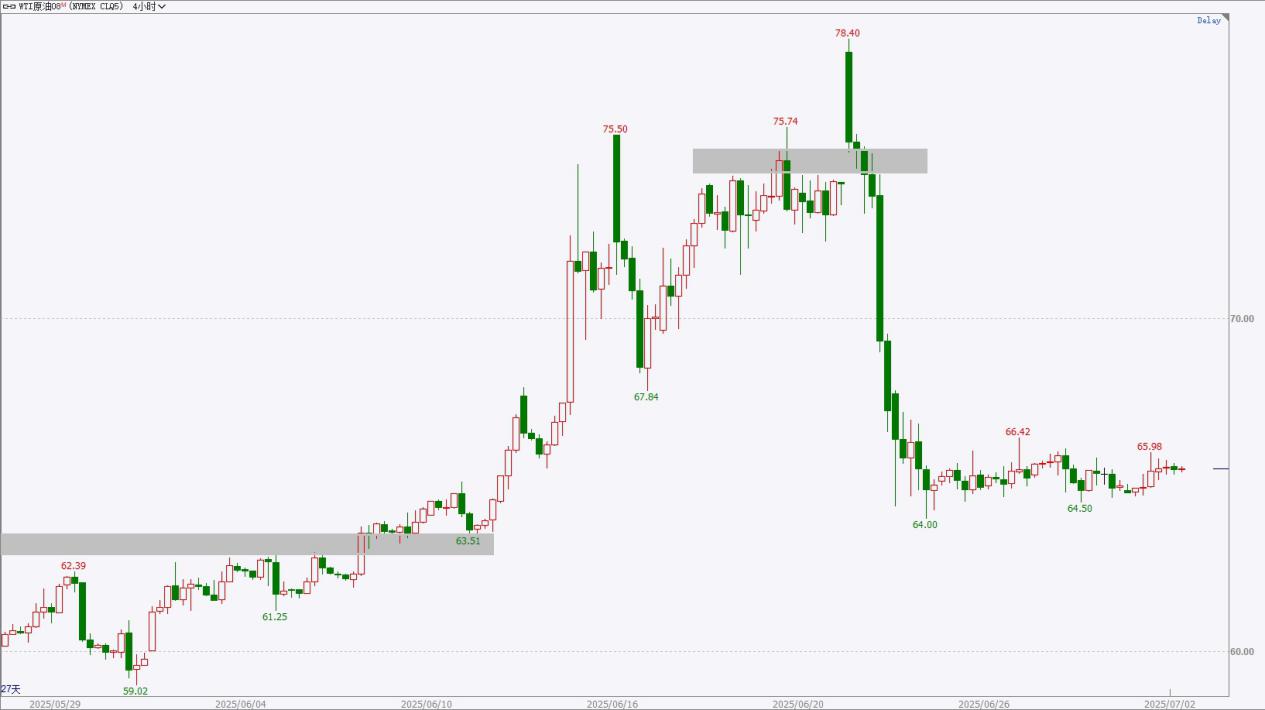
U.S. crude oil has recently shown mild performance, with slight fluctuations and consolidation on the daily chart, not much volatility, currently approaching an important support area. Pay attention to whether there will be signs of stabilization, and then look for low long opportunities. Overall, crude oil has seen a significant rise previously, reaching a pressure area above, with a short-term pullback. The upper pressure area is around 79-80, and the lower support area is around 64-65.
Viewpoint: Short-term adjustment, price retracing to the neckline support structure, pay attention to signs of stopping the decline and stabilizing.
*Pre-market views are time-sensitive and limited, are predictions only, for reference and learning purposes, do not constitute investment advice, and the risk of operation is borne by the individual. Investment carries risks; trading requires caution.
Fundamental Analysis:
The European Central Bank’s June interest rate decision saw a continuous seventh rate cut of 25 basis points, nearing the end of the rate cut cycle, with no discussion on neutral interest rates, lowering inflation expectations for this year and next, and lowering GDP growth expectations for next year. The June Federal Reserve interest rate decision remained unchanged, with a robust labor market, slightly higher short-term inflation, and reduced economic uncertainty, with the dot plot indicating two rate cuts within the year. The Eurozone’s June manufacturing PMI slightly missed expectations, with not much difference. Pay attention to U.S. non-farm payroll data.
Technical Analysis:
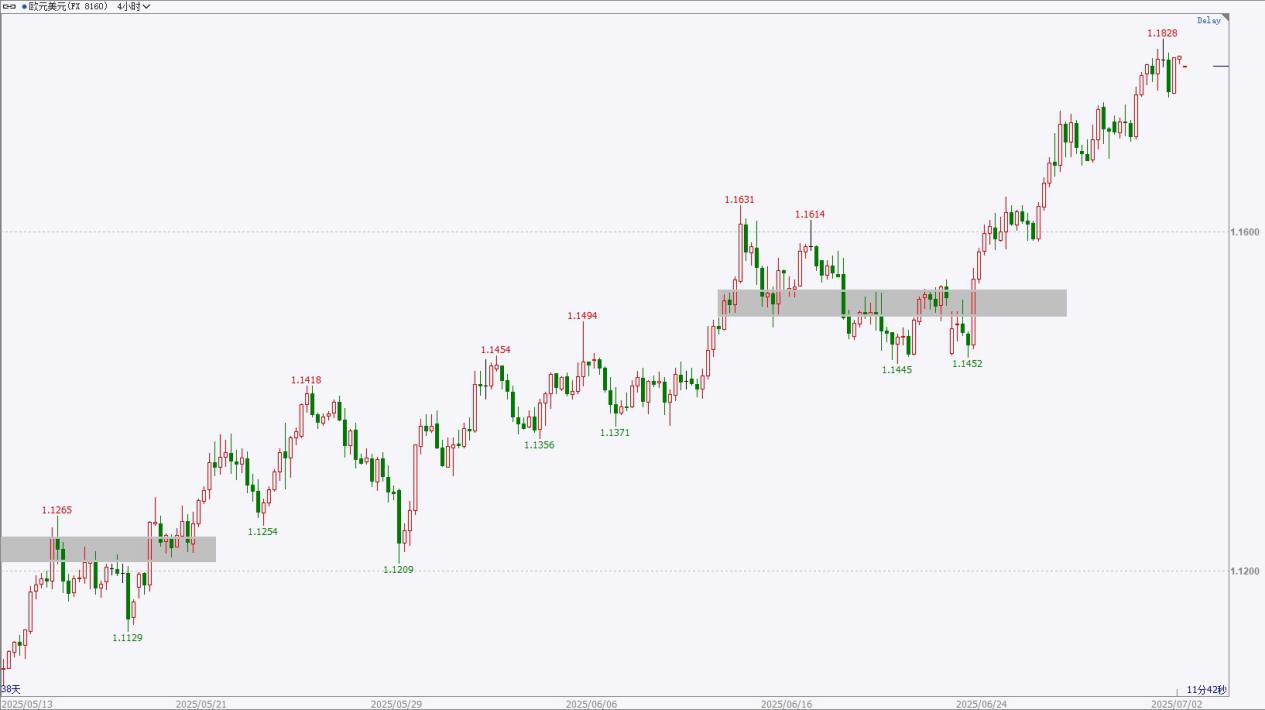
The euro price slightly rose and then fell yesterday, with a small real body bullish candle on the daily chart, showing relatively strong short-term performance. The night session saw fluctuations in the small cycle, with potential resistance near the upper pressure level. If there are long positions, consider taking profits at highs, and the short-term strategy is mainly to look for low long opportunities on pullbacks. Overall, the daily chart shows a fluctuating upward trend, with a strong structure on a larger scale. The upper pressure area is around 1.1830-1.1850, and the lower small-level support area is around 1.1680-1.1700.
Viewpoint: Fluctuating with a strong bias, pay attention to low long opportunities on pullbacks, and take profits at highs.
*Pre-market views are time-sensitive and limited, are predictions only, for reference and learning purposes, do not constitute investment advice, and the risk of operation is borne by the individual. Investment carries risks; trading requires caution.
Daily Reviews
Our award-winning team of analysts provides keen and insightful technical and fundamental analysis to understand daily market news and investment trading opportunities
HTFX Daily Forex Commentary 0702
Time
Data and Events
Importance
04:30
U.S. API Crude Oil Inventory for the week ending June 28
★★★
17:00
Eurozone Unemployment Rate for May
★★★
19:30
U.S. Challenger Job Cuts for June
★★★
20:15
U.S. ADP Employment Change for June
★★★★
22:30
U.S. EIA Crude Oil Inventory for the week ending June 27
★★★★
U.S. EIA Cushing, Oklahoma Crude Oil Inventory for the week ending June 27
★★★
U.S. EIA Strategic Petroleum Reserve Inventory for the week ending June 27
★★★
Variety
Viewpoint
Support Range
Resistance Range
U.S. Dollar Index
Weak oscillation
96-97
99.5-100
Gold
Short-term rebound
3220-3250
3350-3380
Crude Oil
Short-term adjustment
64-65
79-80
Euro
Strong oscillation
1.1680-1.1700
1.1830-1.1850
*Pre-market views are time-sensitive and limited, are predictions only, for reference and learning purposes, do not constitute investment advice, and the risk of operation is borne by the individual. Investment carries risks; trading requires caution.
Fundamental Analysis:
In June, the Federal Reserve maintained interest rates for the fourth consecutive time, with the dot plot indicating two rate cuts within the year. Inflation levels are slightly high, and uncertainty in the economic outlook has somewhat diminished, with the unemployment rate at a low level and a stable labor market. In May, non-farm payrolls added 139,000 jobs, which is basically in line with expectations, and the unemployment rate remained unchanged, indicating a robust labor market. The year-on-year CPI for May rose slightly but was below expectations; the core PCE price index also saw a slight rebound; the ISM manufacturing PMI for May showed a slight increase. Focus on the non-farm data on Thursday.
Technical Analysis:
The U.S. Dollar Index has recently shown weak performance, with daily oscillations trending downward, and new lows in shorter cycles without signs of a rebound. In the short term, it may continue to show weak oscillation, but caution is advised for small-scale rebounds. Overall, the larger structure indicates a weak oscillation, with a large bearish candle on the weekly chart, maintaining a weak trend. The upper resistance area is around 99.5-100, while the lower support area is around 96-97.
Viewpoint: Weak oscillation, prices have reached new lows without signs of stabilization.
*Pre-market views are time-sensitive and limited, are predictions only, for reference and learning purposes, do not constitute investment advice, and the risk of operation is borne by the individual. Investment carries risks; trading requires caution.
Fundamental Analysis:
Geopolitical tensions in the Middle East are escalating, with conflicts between Israel and Iran, and instability in Eastern Europe. The European Central Bank’s June interest rate decision marked the seventh consecutive rate cut of 25 basis points, nearing the end of the rate-cutting cycle, while lowering inflation expectations for this year and next, as well as GDP growth expectations for next year. The Federal Reserve’s June interest rate decision maintained rates, with slightly high inflation levels and a stable labor market, indicating two rate cuts within the year. In May, U.S. non-farm payrolls saw a slight decline in new jobs, with the unemployment rate remaining unchanged; the year-on-year CPI for May showed a slight increase. Focus on U.S. non-farm data.
Technical Analysis:
Gold prices continued to rebound yesterday, showing strong performance in shorter cycles, but there may be selling pressure above. If there are long positions, consider taking profits on highs and watch whether the resistance level can be broken. If it breaks, the trend may strengthen; otherwise, the probability of oscillation back and forth is high. From a larger cycle perspective, the daily chart shows high-level oscillation with prices fluctuating. The upper short-term resistance level is around 3350-3380, while the lower support level is around 3220-3250.
Viewpoint: Short-term rebound, if there are long positions, take profits in a timely manner, and pay attention to whether the current resistance level can be broken.
*Pre-market views are time-sensitive and limited, are predictions only, for reference and learning purposes, do not constitute investment advice, and the risk of operation is borne by the individual. Investment carries risks; trading requires caution.
Fundamental Analysis:
June EIA monthly report slightly raised crude oil prices for this year and next; OPEC monthly report maintains global oil demand growth expectations for this year and next, and maintains economic growth expectations for this year and next; IEA monthly report slightly lowered oil demand expectations for this year and next. At the end of May, the OPEC+ ministerial meeting agreed to set 2025 oil production as the benchmark for 2027, with another round of negotiations expected in early June, potentially reaching an agreement to accelerate oil production increases in July. Pay attention to the EIA crude oil inventory report on Wednesday.
Technical Analysis:
U.S. crude oil has recently shown mild performance, with slight fluctuations and consolidation on the daily chart, not much volatility, currently approaching an important support area. Pay attention to whether there will be signs of stabilization, and then look for low long opportunities. Overall, crude oil has seen a significant rise previously, reaching a pressure area above, with a short-term pullback. The upper pressure area is around 79-80, and the lower support area is around 64-65.
Viewpoint: Short-term adjustment, price retracing to the neckline support structure, pay attention to signs of stopping the decline and stabilizing.
*Pre-market views are time-sensitive and limited, are predictions only, for reference and learning purposes, do not constitute investment advice, and the risk of operation is borne by the individual. Investment carries risks; trading requires caution.
Fundamental Analysis:
The European Central Bank’s June interest rate decision saw a continuous seventh rate cut of 25 basis points, nearing the end of the rate cut cycle, with no discussion on neutral interest rates, lowering inflation expectations for this year and next, and lowering GDP growth expectations for next year. The June Federal Reserve interest rate decision remained unchanged, with a robust labor market, slightly higher short-term inflation, and reduced economic uncertainty, with the dot plot indicating two rate cuts within the year. The Eurozone’s June manufacturing PMI slightly missed expectations, with not much difference. Pay attention to U.S. non-farm payroll data.
Technical Analysis:
The euro price slightly rose and then fell yesterday, with a small real body bullish candle on the daily chart, showing relatively strong short-term performance. The night session saw fluctuations in the small cycle, with potential resistance near the upper pressure level. If there are long positions, consider taking profits at highs, and the short-term strategy is mainly to look for low long opportunities on pullbacks. Overall, the daily chart shows a fluctuating upward trend, with a strong structure on a larger scale. The upper pressure area is around 1.1830-1.1850, and the lower small-level support area is around 1.1680-1.1700.
Viewpoint: Fluctuating with a strong bias, pay attention to low long opportunities on pullbacks, and take profits at highs.
*Pre-market views are time-sensitive and limited, are predictions only, for reference and learning purposes, do not constitute investment advice, and the risk of operation is borne by the individual. Investment carries risks; trading requires caution.
Latest Reviews
HTFX Daily Forex Commentary 0819
HTFX Daily Forex Commentary 0815
HTFX Daily Forex Commentary 0812
HTFX Daily Forex Commentary 0811
Choose a Trusted Broker for Trading
Over 300 employees worldwide, more than 1,000 products, top-tier liquidity